



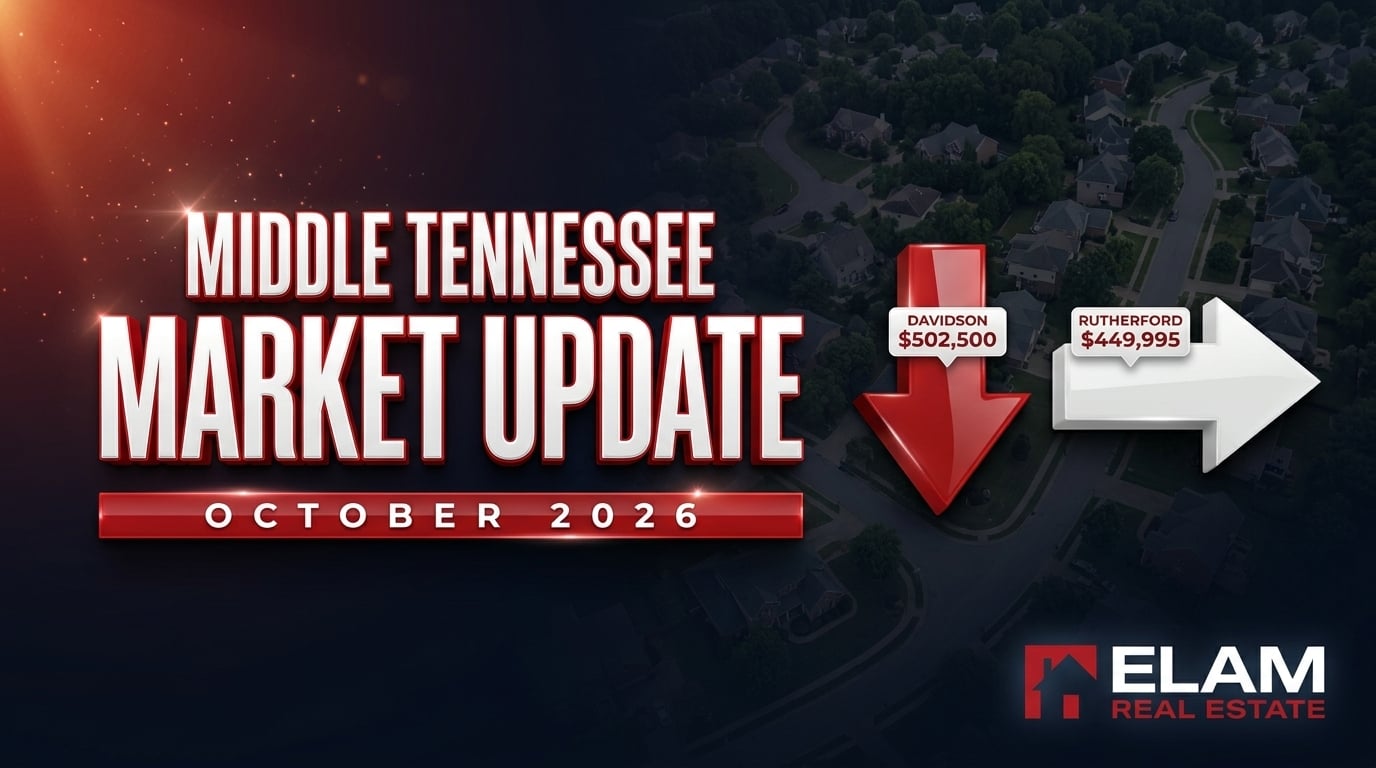
October 2026 told the same story in both counties, at two different speeds. Fewer sellers listed, fewer buyers signed contracts, and the number of homes for sale still grew. In Davidson County that pushed supply past six months and pulled prices down about 5%. In Rutherford County supply rose even faster in percentage terms, yet prices held level. All figures below are single-family homes, compared with October 2025.
In October 2026, Davidson County's single-family median sale price was $502,500, down 5% from a year earlier, with 6.27 months of supply and homes averaging 64 days to contract. Rutherford County's median was $449,995, flat year over year, with 4.81 months of supply and 57 days to contract. Both counties had fewer new listings and closings but more homes for sale than last October.

What Happened in the Middle Tennessee Housing Market in October 2026?
Davidson County recorded 1,052 new listings (down 27%), 549 homes newly under contract (down 17%) and 580 closings (down 16%). Active inventory rose 5% to 3,163 homes. The average sale price was $722,878, down 4%, and the median was $502,500, down 5%. Months of supply reached 6.27, up 22%.
Rutherford County recorded 560 new listings (down 12%), 313 homes newly under contract (down 11%) and 334 closings (down 15%). Homes for sale rose 11% to 1,431. The average sale price was $499,602, up 2%, and the median was $449,995, unchanged. Months of supply reached 4.81, up 26%.
The short version: Davidson now sits on the buyer's side of the six-month line, and Rutherford is moving toward balance without giving up price.
What Is Happening in the Davidson County Housing Market?
Activity slowed on both sides of the sale in Davidson County, and supply grew anyway. Sellers brought 1,052 new single-family listings to market in October, 384 fewer than the 1,436 listed in October 2025. Buyers signed 549 new contracts, down from 660. Closings fell from 693 to 580.
When contracts fall faster than supply, homes accumulate. Active inventory averaged 3,163 homes, up from 2,998. That works out to roughly 5.8 active listings for every home that went under contract during the month.
Speed barely changed. Homes averaged 64 days from listing to contract, against 63 a year earlier. The homes that are priced where buyers expect are still selling on a familiar timeline; there are simply more that are waiting.
What Is the Median Home Price in Davidson County?
The median single-family sale price in Davidson County was $502,500 in October 2026, down 5% from October 2025. The average sale price was $722,878, down 4% from $756,524, though still above the $668,729 average of October 2024.
The $220,000 gap between average and median is normal for Davidson County. A relatively small number of high-priced sales lifts the average, while the median shows what the middle of the market paid. Buyers shopping near $500,000 should watch the median; it describes their segment better.
For month-to-month context, ELAM's September update put the Davidson median at $522,000. One month does not make a trend, and the mix of homes sold changes every month, but the direction matches the year-over-year numbers.
Is Davidson County a Buyer's Market?
By the most common yardstick, yes. Davidson County had 6.27 months of single-family supply in October 2026, up 22% from 5.13 a year earlier. Six months is the line many in the industry treat as the start of a buyer's market, and Davidson crossed it. ELAM's September update had it at 5.62.
Months of supply is a county-wide average. Individual price points and areas can run tighter or looser than 6.27, so the label is a starting point for a conversation with an agent, not a rule for every listing.
What this means for buyers
Buyers have room to negotiate on three things: price, repairs and closing costs. With more than 3,100 homes available and fewer competing contracts, a buyer can compare several options, ask for inspection repairs and request seller-paid costs with a realistic chance of getting them. The strongest position still comes from a full pre-approval and a clear idea of recent sold prices near the home.
What this means for sellers
Price it right from day one. Buyers are comparing each listing against a larger set of alternatives, and a home that starts too high tends to sit while newer listings arrive around it. Sellers should also budget for negotiation, whether that is a repair request or a closing-cost credit, and decide in advance where their floor is.
What Is Happening in the Rutherford County Housing Market?
Rutherford County gave buyers more breathing room in October without prices giving ground. Sellers listed 560 new single-family homes, 74 fewer than the 634 listed in October 2025, or about 88% of last year's pace. New contracts slipped from 350 to 313, and closed sales fell from 395 to 334.
As in Davidson, the pool of available homes grew while activity cooled. Homes for sale rose by 139 to 1,431, an 11% increase. That is roughly 4.6 active listings for every new contract, a tighter ratio than Davidson's 5.8.
Homes took a little longer to find a buyer: 57 days from listing to contract, up from 54 a year earlier.
What Is the Median Home Price in Rutherford County?
The median single-family sale price in Rutherford County was $449,995 in October 2026, flat compared with October 2025. The average sale price was $499,602, up 2% from $490,162 and slightly above the $496,878 average of October 2024.
Put plainly, Rutherford prices have moved within a narrow band for two years. The average sits only about $50,000 above the median, which points to a market concentrated in a tighter price range than Davidson's, where that gap is more than four times as wide.
ELAM's September update put the Rutherford median at $430,000, so October's figure is higher month over month. As always, a single month reflects which homes happened to close.
Is Rutherford County a Buyer's Market?
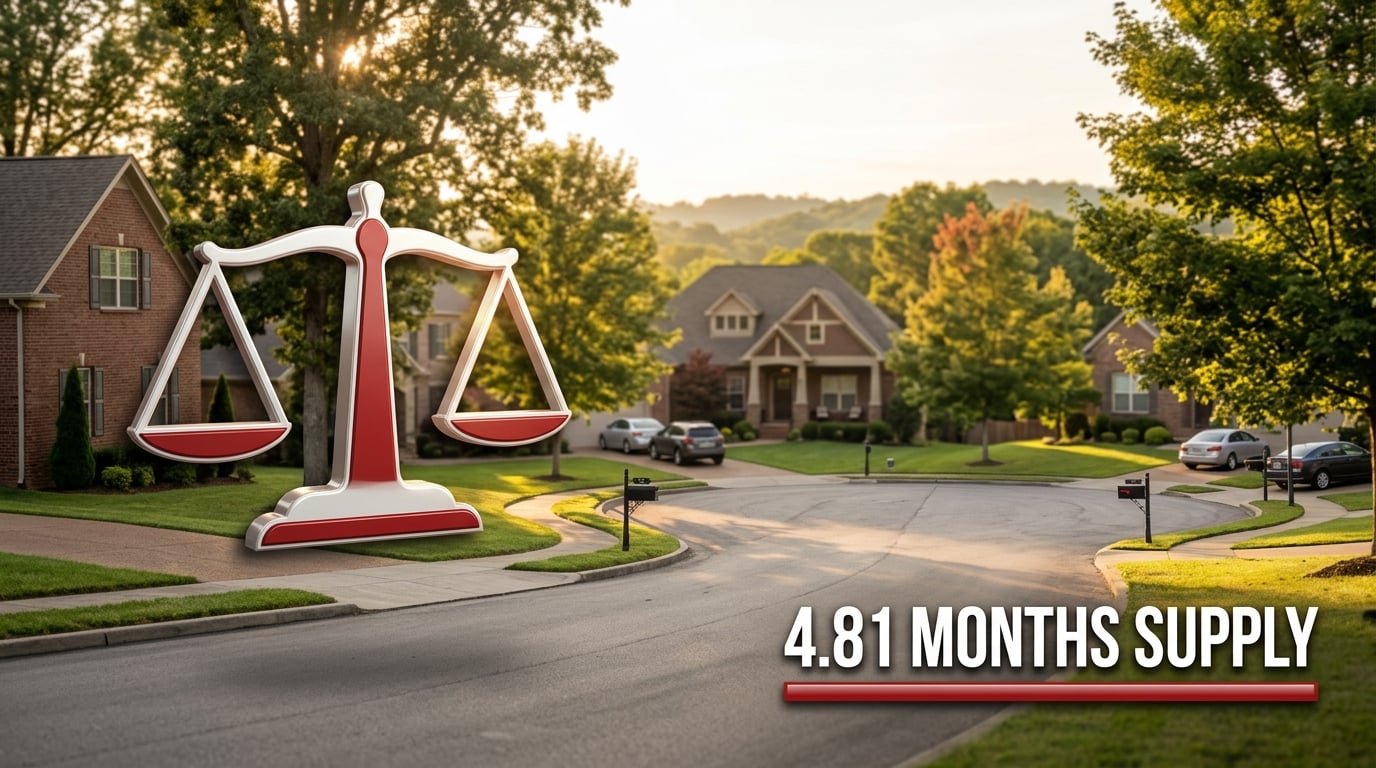
Not yet. Rutherford County had 4.81 months of single-family supply in October 2026, up 26% from 3.83 a year earlier and up from 4.61 in ELAM's September update. That is below the six-month mark and is better described as a market edging toward balance. A year ago it leaned clearly toward sellers.
The direction matters as much as the level. Supply has grown by about a quarter in twelve months while prices stayed level, so buyers have gained options without sellers losing value.
What this means for buyers
Take your time and shop around. With 1,431 homes for sale and fewer competing contracts than last October, there is less pressure to decide on the first showing. Because prices are holding, expect less room on price than in Davidson County; the leverage here is more likely to show up in terms, repairs and timing.
What this means for sellers
Sharp pricing and great presentation matter more than they did a year ago. Prices have held, so a well-prepared home priced in line with recent sales can still sell near its value. A home that is overpriced or under-prepared now competes with 139 more listings than it would have last October.
How Do Davidson and Rutherford Counties Compare in October 2026?
Davidson is the higher-priced, slower, better-supplied market; Rutherford is about $52,500 lower at the median, moves about a week faster and has roughly a month and a half less supply. Figures are single-family homes for October 2026, with the change from October 2025.
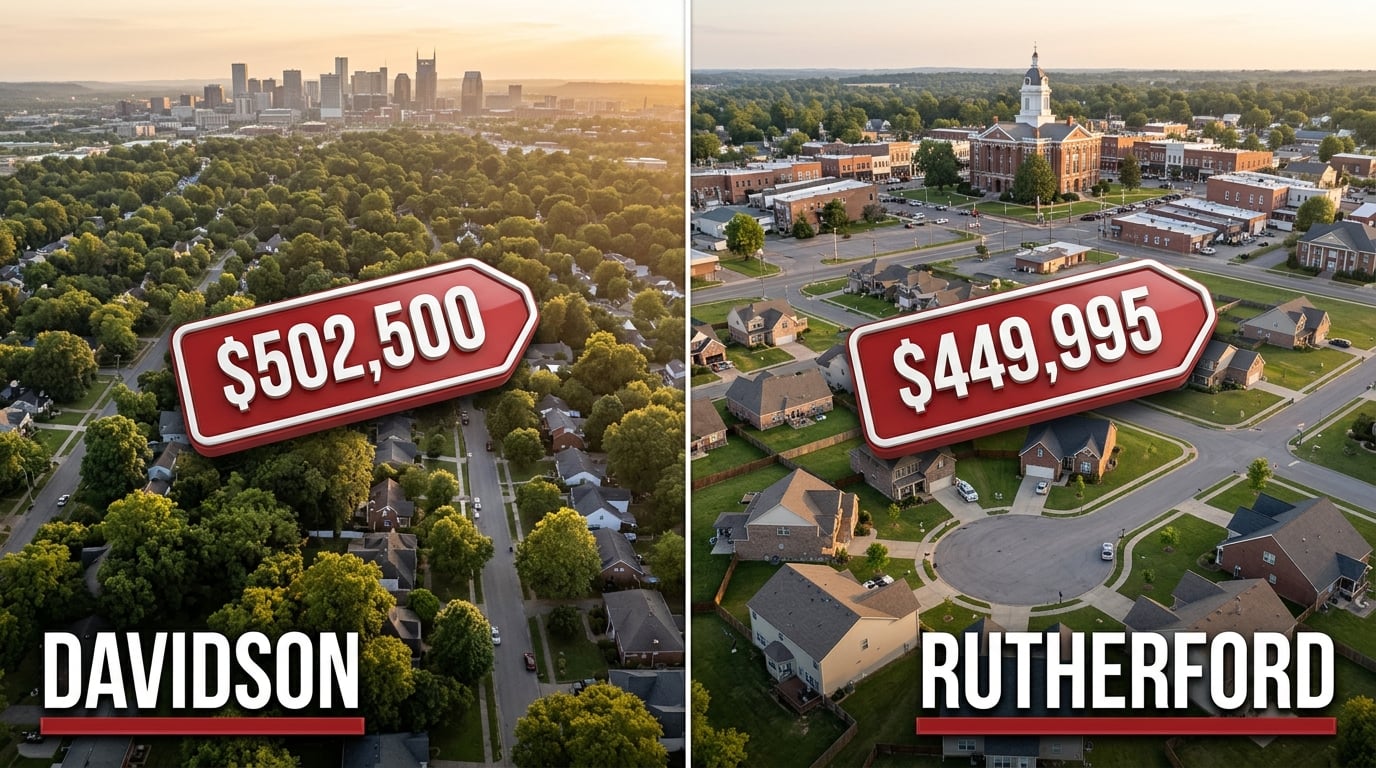
On price, Davidson County's median sale price was $502,500 (down 5%), against $449,995 (flat) in Rutherford County. The average sale price was $722,878 in Davidson (down 4%) and $499,602 in Rutherford (up 2%).
On supply, Davidson had 6.27 months of supply (up 22%) and 3,163 homes for sale (up 5%). Rutherford had 4.81 months of supply (up 26%) and 1,431 homes for sale (up 11%).
On activity, Davidson recorded 1,052 new listings (down 27%), 549 homes newly under contract (down 17%) and 580 closings (down 16%). Rutherford recorded 560 new listings (down 12%), 313 homes newly under contract (down 11%) and 334 closings (down 15%).
On speed, homes averaged 64 days from listing to contract in Davidson (up from 63) and 57 days in Rutherford (up from 54).
Two patterns stand out. Supply grew by a similar proportion in both counties, but only Davidson saw prices fall with it. And Davidson's new listings dropped more than twice as sharply as Rutherford's, which suggests some Davidson sellers are choosing to wait.
Is Now a Good Time to Buy or Sell a Home in Middle Tennessee?
It depends on which side of the sale you are on and which county you are in. The October numbers favor buyers more than at any point in the past year, especially in Davidson County, and they reward sellers who price and prepare carefully.
For buyers, late fall and winter usually bring less competition, and this year that seasonal lull arrives on top of higher supply. Davidson buyers have the most negotiating room. Rutherford buyers have more choice than a year ago at prices that have not moved. Your monthly payment still depends on your financing, so compare lender quotes before you compare houses.
For sellers, homes are still selling: 580 closed in Davidson and 334 in Rutherford in October. The homes that sell are the ones that match what buyers see in recent sold prices. Waiting for spring is an option, but spring also brings more competing listings.
None of this is a forecast. It is a reading of one month of data, and the right decision depends on your own timeline, budget and property.

Elam's Local Insight
The county averages hide how uneven this market is. In both counties, well-priced homes in good condition are still going under contract in about two months, while homes that miss on price or presentation are the ones building up in the inventory count. That is why two sellers on the same street can have very different experiences right now, and why buyers often find more flexibility on a listing that has been sitting than on one that is new.
At Elam Real Estate, we don't guess. We guide. Whether you are buying, selling or keeping an eye on the market, an Elam agent can show you what these numbers mean for your price point and your part of Davidson or Rutherford County. Find your advantage. Talk to an Elam agent: call (615) 890-1222 or visit elamre.com.
Frequently Asked Questions
Are home prices dropping in Nashville? In Davidson County, yes, modestly. The single-family median sale price was $502,500 in October 2026, down 5% from October 2025, and the average was $722,878, down 4%. The average is still higher than it was in October 2024.
Are home prices dropping in Murfreesboro and Rutherford County? No. Rutherford County's single-family median was $449,995 in October 2026, flat year over year, and the average rose 2% to $499,602.
How many months of supply make a buyer's market? Six months is the threshold many in the industry use. Below about four months generally favors sellers, and the range between is considered balanced. Davidson County was at 6.27 months in October 2026 and Rutherford County was at 4.81.
How long does it take to sell a home in Middle Tennessee right now? In October 2026, single-family homes averaged 64 days from listing to contract in Davidson County and 57 days in Rutherford County. Closing adds time after the contract is signed.
Is Davidson County or Rutherford County more affordable? Rutherford County's median single-family sale price was about $52,500 lower than Davidson County's in October 2026. What is affordable for a given buyer also depends on financing, property taxes, HOA fees, home condition and commute.
Sources
- Realtracs Market Trends Report, "Oct 2026 Market Update," Residential: Single Family, Davidson County, TN, report courtesy of Elam Real Estate.
- Realtracs Market Trends Report, "Oct 2026 Market Update," Residential: Single Family, Rutherford County, TN, report courtesy of Elam Real Estate.
- ELAM Real Estate monthly market update videos, Davidson County and Rutherford County, October 2026 and September 2026.
All percentage changes compare October 2026 with October 2025. Figures are as reported when ELAM's October videos were produced; Realtracs revises monthly totals slightly as late entries post.
Check out this article next